Read project dashboards
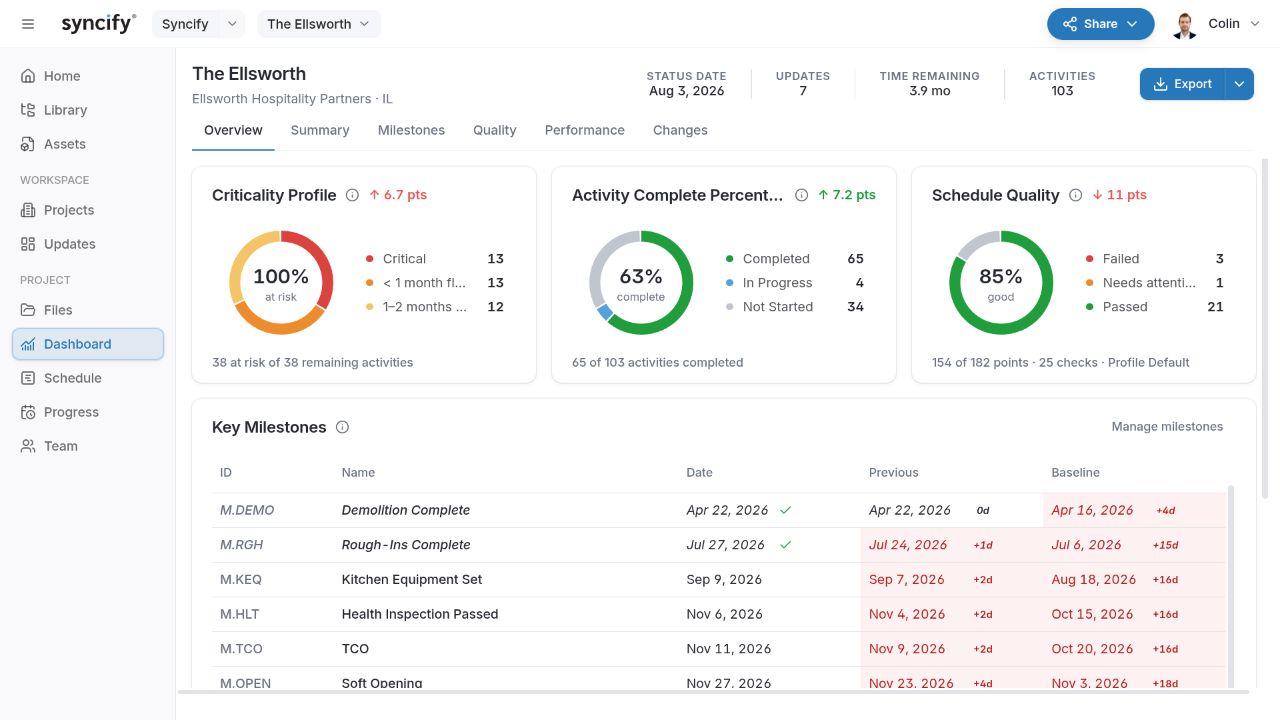
Open Dashboard within a project to review the plan and its history. Dashboards are most useful when the project’s Current schedule, Baseline, and update sequence are deliberate and consistent.

Prepare the schedule history
Before interpreting trends, open Files and check:
- The intended schedule is marked Current.
- An agreed reference file is marked Baseline where baseline comparison is needed.
- Issued reporting files have Update # tags in the correct order.
- Each file has the right status date and represents a distinct reporting period.
- Important historical files are preserved as versions or copies rather than continually overwritten.
A single imported schedule can support a current-state review, but it cannot supply a history of previous updates that were never imported or saved. Some metrics also need a valid baseline or a preceding reporting window. A blank metric is not necessarily zero.
Choose a dashboard tab
| Tab | Use it for |
|---|---|
| Overview | A quick picture of the current plan, key dates, and reporting indicators |
| Summary | A condensed schedule timeline with views, filters, grouping, and comparison |
| Milestones | Important event dates and their movement across the reporting history |
| Quality | Schedule-check results and trends |
| Performance | Progress and performance indicators over time |
| Changes | Activity, duration, logic, constraint, and other changes between schedules |
Check the header’s reporting context before interpreting a chart. Where a chart supports previewing an update, hover or use its update controls; Escape clears an active preview. A preview of a historical update is not a change to the project’s Current file.
Understand the Overview cards
| Card | What it tells you | What to check before using it |
|---|---|---|
| Criticality Profile | Float distribution of unfinished activities and the share at risk | The float bands and activity population; it is not the same as one selected Driving Path |
| Activity completion | Counts of activities by status | It is activity-count completion, not a weighted physical-progress or cost-earned percentage |
| Quality | The last saved result for the project’s default quality profile | Whether the score is current and which profile/checks produced it |
| Key milestones | Selected milestone dates with previous and baseline comparisons | The selected milestone list and which files supply the reference dates |
| SPI | Actual completion divided by baseline-planned completion; 1.00 is on plan | Baseline and completion counts; this is not an imported cost-earned-value calculation |
| Hit Rate | The share of activities planned to start or finish in the update window that did so | Whether Starts or Finishes is selected and whether the window contains planned work |
| Compression | How much remaining baseline-paced work must be compressed into the available time | The Original/Adjusted setting and the reporting date; a negative value indicates surplus time |
Open the card definitions and available detail views when you need the denominator or the contributing activities. Do not compare two percentages until you know what each counts.
Use the Summary timeline
The Summary tab provides a compact view of the plan. Use Views, Filter, Group, and Spotlight to focus it, and Compare to Baseline when an appropriate reference is available.
Use the previous/next update controls or update picker to inspect an earlier issue. Find activities by name or ID and adjust zoom for the time span you need.
Summary date spans and variances can be expressed as calendar-day differences, while activity durations are working-calendar quantities. A ten-day span on a summary is not automatically ten working days of activity duration.
Keep the milestone review relevant
Use the milestone management controls to choose the events the project should track. Select meaningful contractual, handoff, or operational milestones rather than every zero-duration event by default.
When a milestone moves, identify the previous and baseline reference first, then open the schedule and trace its Driving Path. The dashboard shows the outcome; the schedule provides the logic behind it.
Review quality and performance over time
Keep the quality profile consistent when comparing scores. A changed threshold or weight can change the score even if the underlying plan did not improve. Re-run checks when appropriate; an older saved score should not be presented as a fresh check of today’s edits.
For performance trends, investigate both the percentage and its population. A reporting period with very few planned starts can swing sharply when one activity is missed. A change in activity scope can also affect count-based measures.
Investigate changes and export
Use Changes to inspect the update history or compare two files. Drill into a category to identify affected activities, and use the available Excel export when you need the comparison details outside Syncify.
Use the dashboard’s Export controls for available outputs. For a schedule PDF with specific rows, columns, and a timeline, use Print from the schedule.
When something is missing or unexpected
Check Current, Baseline, update tags, status dates, available historical files, and the selected preview. A milestone with no counterpart in a reference file cannot have a normal like-for-like variance. An unavailable metric may lack a denominator or the prior period it needs.
Correct the file designations and source data before changing the plan merely to make a chart look right. See Troubleshooting.